The United Nations Conference on Trade and Development (UNCTAD) recently announced the top 10 ports by container volume in a report on global shipping in 2017. The Chinese ports include Shanghai (number 1), Shenzhen (number 3), and 5 more, all in the top 10. Singapore (number 2) and Busan (number 5) were high on the list as well, making it clear that Asian ports are the "core" of global shipping.
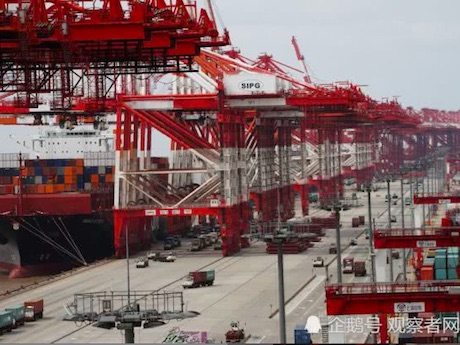
Yangshan Deep-Water Port
The overall volume of containers processed in 2017 increased by 4% in comparison with 2016 and reached 10.7 billion tons. The overall volume dropped to 7.9 billion tons in 2009 as a result of the financial crisis, but smoothly increased again afterwards. The 4% growth is estimated to continue in 2018, but the "Sino-American trade war" constitutes an unpredictable element.
The overall volume of processed containers amounts to 752 million standard 20 feet containers, which is an increase of 6% in comparison with the previous year. The volume of containers processed in Asia accounts for 64% of the total volume worldwide. Europe comes second with 16% and North America comes third with 8%.
Shanghai processed 40.23 million standard containers, while Singapore processed 33.67 million standard containers. There are 15 ports worldwide with a volume of processed containers that exceeds 10 million standard containers. Japanese ports have not made in the top 20 yet. Domestic data shows that Tokyo Port processed 5.05 million standard containers, while Yokohama processed 2.93 million standard containers, and Kobe processed 2.92 million standard containers.
The report also stated that "competition in global shipping is fierce as the industry develops at a high pace and the scale of shipping increases daily. Ports are forced to anticipate these developments."
Source: guancha.cn