Australian apple and pear business owners are invited to participate in a national pilot project to understand the total cost of production, providing a clear understanding of where their business sits on a domestic, and potentially international, scale of competitiveness.
APAL CEO Phil Turnbull said that accurate and reliable insights are imperative for business owners. “This is why benchmarking has been identified as a key Future Business focus area,” Phil said.
The new benchmarking activity will help understand how much businesses are paying for specific activities and commodities, how these costs compare within the industry and will identify an untapped opportunity to ease costs through procurement processes.
“Our initial assessment of the industry’s cost structure highlighted labour, insurance and utilities as being three of the most significant costs. These are the initial areas of focus,” Phil said.
“The intention is to collect as much data on these three cost areas, both domestically and internationally to map where we sit as an industry and where you’re placed as a buyer.”
All industry members are invited to express their interest in participating in the data collection on a strictly confidential basis. “This data will be aggregated with only contributors receiving a report on where they are positioned against the benchmarks,” Phil said.
“Individual companies will not be identified in any way. This exercise provides an opportunity for anyone who shares their data to receive an indication as to where they sit within the industry aggregate.”
Examples of areas where the data collection may provide valuable insights are around costs of production including, but not limited to, electricity, labour, freight, water, insurance, chemicals and packaging costs per hectare.
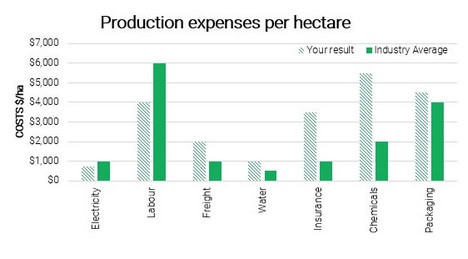
Figure 1: An example of the overview individuals will receive, highlighting where they sit in terms of the industry average based on data collected from participants for each cost area.
Phil said that with technological developments, process improvements, an increase in pooled resources and the press for consolidation, knowing the true cost of production will assist in helping understand what a cost/benefit outcome might be. “It will help us understand what industry can and cannot afford in terms of upgrading and investment. And will also help determine our efficiencies of scale and highlight where some costs could be reduced,” Phil said.
This new benchmarking project, delivered through APAL’s Future Business program, is a continuation from the Packhouse Optimisation Project completed in 2017, which was undertaken to understand the average cost of packing apples in Australia. This project focused on storing, grading, packing and selling apples but didn’t include the cost of actually growing the fruit.
“We view this as a starting point and would like to build on the data collected in that study,” Phil said.
“This new benchmarking exercise will provide a broader perspective on the cost of production from the orchard through to the sale of fruit and will involve ongoing data collection to strengthen the figures and provide a useful data map as to where the industry and your business are placed.”
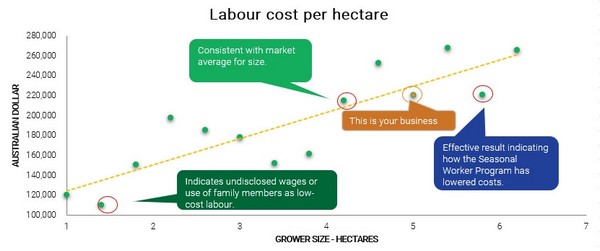
Figure 2: An example of a deeper-dive into figures each benchmarking participant will receive highlighting where an individual business fits within the aggregate.
APAL will also be undertaking a tree census project in parallel with the benchmarking activity which will help pinpoint the current varieties and tree numbers planted across each growing region. “Understanding both elements of data will assist decision making regarding future planting and development,” Phil said. “This could be an invaluable source of information when considering additional investments or even divestment.”
All interested apple and pear growing businesses and packing sheds are invited to participate in these two projects and APAL has enlisted Jason Nam, a Senior Accountant at Stannards Accountants and Advisors to collect and interpret the data.
To make the data collection process viable, Jason will be requesting a complete profit and loss statement along with detail in relation to block numbers and tree counts. The tree census in particular, will be beneficial for businesses who have unfortunately been impacted by the recent bushfires. This drives the importance for the need to understand current cost factors, environmental impacts on these costs, especially the rising cost of insurance, and the opportunity to pool resources and create a Discretionary Mutual Fund (DMF).
For more information or to express your interest, contact Richelle Zealley, Manager, Future Business: rzealley@apal.org.au / 03 9329 3511 or Alvin Kee, Financial Planning & Analysis Manager: akee@apal.org.au / 03 9329 3511.